
As noted in Chapter 5, the conservation planner should evaluate the whole farm for natural resource concerns – soil, water, air, plants, animals, energy, and the human environment. The human environment includes farmer/family attitudes and values, farming economics, currently owned farm equipment, social considerations, and the farmer’s commitments to neighbors and neighborhoods. It is important to evaluate the big picture to avoid conflicts in the implementation of conservation practices. Implementation of one conservation practice can restrict or make more complex the installation of future conservation practices. Additionally, the planner does not want to exacerbate an existing resource concern or topographic or hydrologic condition on the land. Therefore, even when addressing a single resource concern, such as wind erosion, one must complete a minimum due diligence during the inventory stage of conservation planning and provide a sufficient set of alternative actions to avoid future complications.
With wind erosion as a resource concern, the planner will inventory soil resources, benchmark cropping system, tillage system, field layout, and – of critical importance – wind speed and direction. The best method of getting a quick snapshot of wind speeds and direction is through the use of wind roses (Figure 6-58). NRCS hosts a wind rose data set76 for key areas in all States and U.S. Territories. This dataset was developed in 2003 and is based on the 30-year climatic “normals” period of 1961-1990. Additional customized wind roses at more locations and for more recent time periods are available from the National Oceanic and Atmospheric Administration (NOAA).77 Given considerations of current and projected future climate change, this site may be more flexible and therefore advantageous to use than the NRCS site. You must register and create a login to utilize the site, and its use is free of charge.
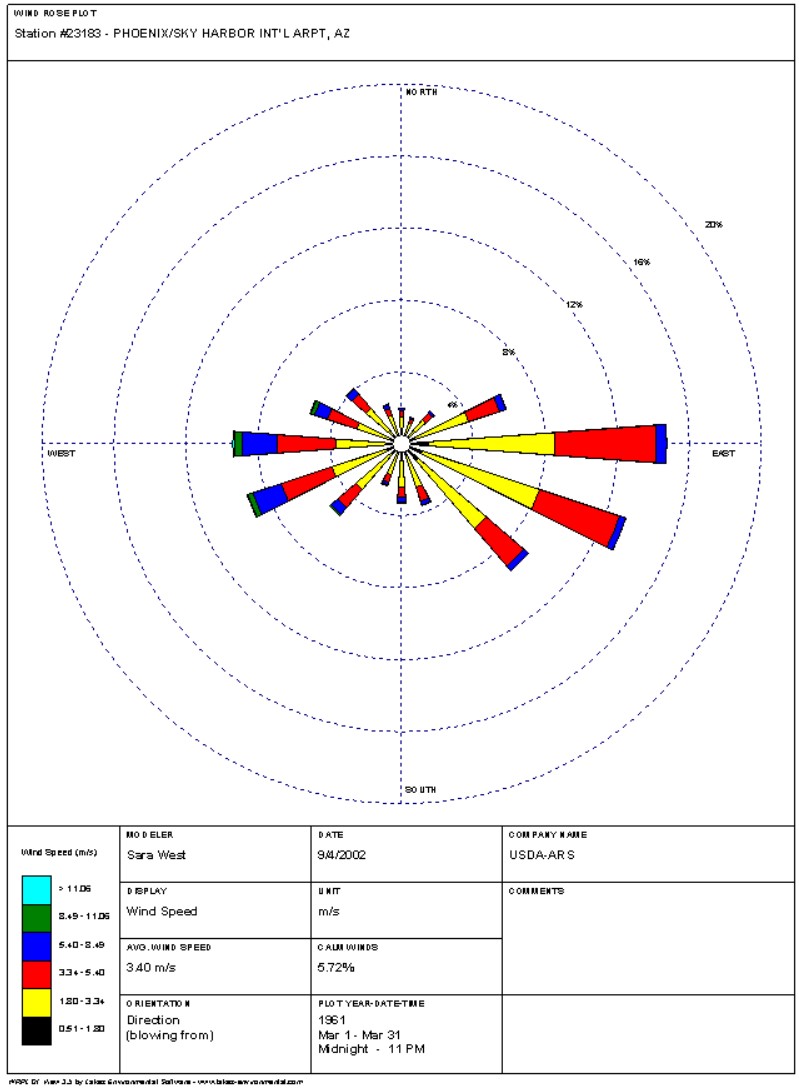
Figure 6-58 depicts a wind rose generated for Phoenix, AZ for the month of March based on the period from 1961-1990. The spokes represent the direction from which winds blow, separated into 16 directions- the cardinal, ordinal and half winds. The concentric circles represent frequency of winds expressed in percentage of time for the period evaluated. The colors of the spokes are separated into ranges of wind speed as described in the legend. For this wind rose, the concentric circles are labeled as 4, 8, 12, 16 and 20 percent. For example, we can see the highest wind speeds come directly from the west (green), and in total, winds come from the west about 9.5% of the time during March. The highest wind speeds (green) make up about 1% of wind occurrence in March, of which the typical highest wind speed range is 8.49 to 11.09 m/s. Meters per second is commonly used in wind roses, since most wind erosion, air pollution, and other climate-oriented models use these units of measure. If desired, convert to miles per hour by multiplying by 2.237. The NOAA website allows you to select the units you desire.
The wind velocity at which soil particles begin to move across the soil surface is called the threshold friction velocity. For agricultural soils, the threshold friction velocity at which sand particles begin to move is about 5.5 m/s, but it is variable and dependent on soil texture and organic matter content. In-field conditions, like soil moisture and surface roughness (cloddiness), are other key variables that will affect threshold friction velocity. From a conservation planning standpoint, we can consider winds greater than 5.5 m/s as potentially erodible wind speeds. Thus, looking back at the wind rose, the planner would be concerned with speeds indicated with a blue or green color. About 9% of March winds fit this category, ranging from northwest to southwest directions, with the bulk of those strongest winds coming directly from the west. Therefore, the best direction to orient linear wind barriers, including tillage practices, would be in a north-south direction – perpendicular to the prevailing erosive wind direction.
March was the month chosen for this example as it is the month in the Phoenix area that farmers begin preparing their land for planting. In a conventional tillage system, there are multiple field operations conducted during this period, making it the most critical period for wind erosion for these farmers. Key months for wind evaluation will differ across the country, based on the cropping systems and climate. In fact, the period of evaluation may be greater or less than a month; this is another advantage of the NOAA wind rose website, as the period of evaluation can be altered specifically to the days of concern for each farmer.
The conservation planner uses this information to develop alternatives with the aforementioned conservation practices. These alternatives are evaluated with the Wind Erosion Prediction System (WEPS). In fact, the farmer’s current benchmark condition, considering his soils, cropping system, and tillage operations, is evaluated first through WEPS. This establishes an annual erosion rate for comparison of management practice options. Ideally, the planner will propose a system that meets long-term production sustainability goals. This is the acceptable soil loss rate (“T”) determined in Web Soil Survey for each soil. For most deep agricultural soils, this rate is determined to be 5 tons/acre/year. WEPS takes into account a vast array of climatic, soils, agronomic, irrigation, and wind barrier conditions to evaluate alternatives. Since WEPS is process-based, it evaluates conditions on daily increments, considering tillage operations, crop growth, irrigation, and climatic factors. The planner can assess critical time periods and potentially hazardous tillage operations and make recommendations for simple variations to the farmer’s basic crop rotation and tillage operations. Alternatively, the planner can add cover crops or other conservation practices to show the incremental benefits. The selling points of reduced erosion are expected yield gains, improved soil health, improved infiltration (to capture and store water in the soil profile), and improved air quality.
References
76. Wind Rose Resources. NRCS National Water and Climate Center. https://www.wcc.nrcs.usda.gov/climate/windrose.html. Accessed July 12, 2019.
77. Wind Roses – Charts and Tabular Data | NOAA Climate.gov. https://www.climate.gov/maps-data/dataset/wind-roses-charts-and-tabular-data. Accessed July 22, 2019.
78. Index of /ftpref/downloads/climate/windrose/arizona/phoenix. https://www.wcc.nrcs.usda.gov/ftpref/downloads/climate/windrose/arizona/phoenix/. Accessed July 23, 2019.